The calendar audit - where does my time go?
An agent reads my calendar every Monday, classifies every event, and combines it with GitHub, GA4, and task data into one dashboard. Eight weeks in: my mental model of my own time was wrong by thirty percent. You could build the same thing by Friday.

End-of-year reviews, 1-2-1s, CEO updates all want numbers. Customer briefings, webinars, conference sessions, demos that used to take a sprint and
now take an afternoon — I can tell you roughly how many I did. I cannot tell you exactly. "Roughly quite a lot" is not a metric.
On 7 May I fixed that in ninety minutes. You could do the same thing by Friday
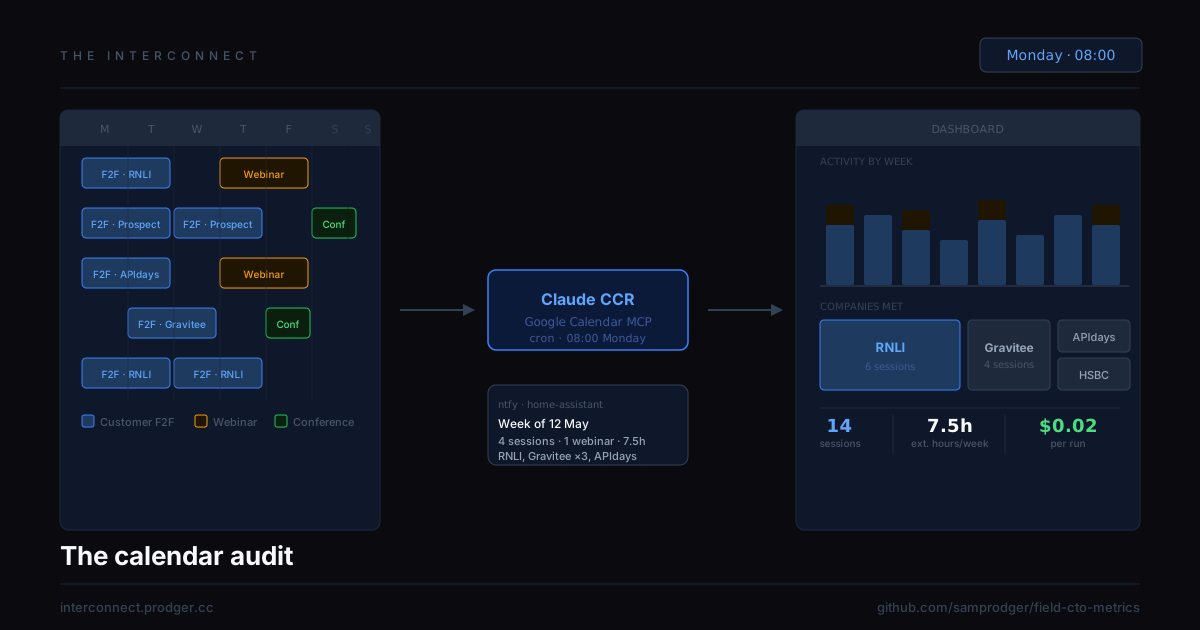
The idea was simple: an agent that reads my Google Calendar every Monday morning, classifies each event — customer F2F, webinar, conference
session, internal — deduplicates the recurring noise, and extracts the company domain from each external attendee. Then pulls GitHub issues and
PRs closed that week across nine repos. Then hits GA4 for Interconnect traffic. Then reads task completion from Orbit and Todoist. Then commits a
single CSV row to a GitHub repo and pings my phone. A GitHub Pages dashboard renders the lot.
One Monday morning run. One row. Calendar, output, reach, and tasks in the same place.
The build
The agent runs on a cron schedule. It wakes at 08:00 on Monday, pulls the previous seven days from Google Calendar via MCP, and runs a
classification pass. GitHub, GA4, Orbit, and Todoist are pulled via their APIs in the same run.
The classification prompt is the interesting part. I wanted it to be opinionated. An external customer session should not be confused with an
internal team sync that happens to have a customer on the invite. The model gets the full attendee list, event title, duration, and location. It
returns a structured object: category, primary company, customer-facing flag, delivery format, estimated audience size for webinars.
What surprised me was the classification quality. I had expected it to struggle with deduplication — recurring one-to-ones where the meeting
series has one name and the individual instances another. It didn't. It identified the pattern from the recurrence rule and the consistent
attendee, not from anything I flagged. I had also expected to iterate on the customer-versus-internal boundary. I didn't. One prompt, working on
the first run.
The output
Each run appends one row to metrics.csv. Twenty columns: customer sessions, webinars, conference sessions, external hours, company domains, tasks
completed in Orbit (our task management tool with MCP server) and Todoist, GitHub issues closed and PRs merged, Interconnect users, sessions, pageviews and average session length, LinkedIn impressions, reach, and engagements. Plus a free-text notable field the model fills from anything that stood out in the calendar.
GitHub Pages renders a dashboard from the CSV. Bar charts for activity by category over time. A treemap for companies met, sized by session count.
A separate section for content and reach: GitHub activity, Interconnect traffic, and LinkedIn performance side by side. A YTD summary that grows
as the weeks accumulate. Static HTML, no server, no dashboard tool.
After the run, ntfy delivers a push notification. "Week of 12 May: 4 customer sessions, 1 webinar, 2 conference sessions. Companies: RNLI,
Gravitee ×3, APIdays. 7.5 external hours." I read it with my coffee. It goes away.
The gotchas
Two things took longer than expected.
GPG signing. The agent commits to GitHub, which requires a signing key. The key is provisioned in the agent environment, but user.signingkey was
not set in git config. Fifteen minutes of "why is git refusing to commit" that had nothing to do with the calendar logic.
ntfy in the sandbox. The agent sandbox blocks outbound network calls to non-allowlisted hosts by default. My self-hosted instance at
ntfy.prodger.cc was not on the list. The fix was straightforward once I understood the sandbox was the problem and not something in the network
path. Both are in the README now.
What it tells me
Backfilling the data gave me eight weeks and the dashboard is useful in ways I did not anticipate.
The treemap makes repeat engagement visible. I had six sessions with one prospect over four weeks without consciously registering it as a pattern.
It shows up immediately as the largest block in the treemap. That is information I always had and never organised.
The external hours metric surprises me every week. I consistently underestimate it by about thirty percent. My mental model of my calendar skews
toward the meetings I found difficult, not the actual time distribution. The data does not have that bias.
The most useful line in the whole output is the notable field. The model writes it in first person — "spent most of the week on the Hotels
workshop prep, two F2F sessions in London with customers from APIdays" — and it is accurate enough to jog memory in a way a bare CSV never would.
I have started reading the previous four weeks' notables before any board-level conversation. It takes ninety seconds.
The view I didn't know I needed is the content and reach section. Seeing Interconnect traffic and LinkedIn performance in the same row as customer
sessions makes the relationship legible. A week with a conference session has a measurable trailing effect on both. I wouldn't have connected
those without the data in the same place.
The mental model of your own calendar is wrong. It skews toward the meetings that felt significant, not the actual distribution of your time. A
quarter of "roughly quite a lot" is a quarter you cannot defend, learn from, or repeat. Ninety minutes of build time is cheaper than another
quarter of not knowing.
I built this to solve a specific problem: I did not know what I had done last quarter. I now do.
Sam Prodger is Field CTO at Gravitee and writes The Interconnect.
Continue this conversation
Open a pre-loaded prompt in your preferred AI. Edit it before you send.
Continue in Claude Continue in ChatGPT Continue in Grok Continue in PerplexityPre-loaded with context from this article. Opens in a new tab.